App
Interactive page
Ecommerce
Product
User Journeys
How shoppers move through a session, from session start to purchase or exit, with filters and two flow charts.
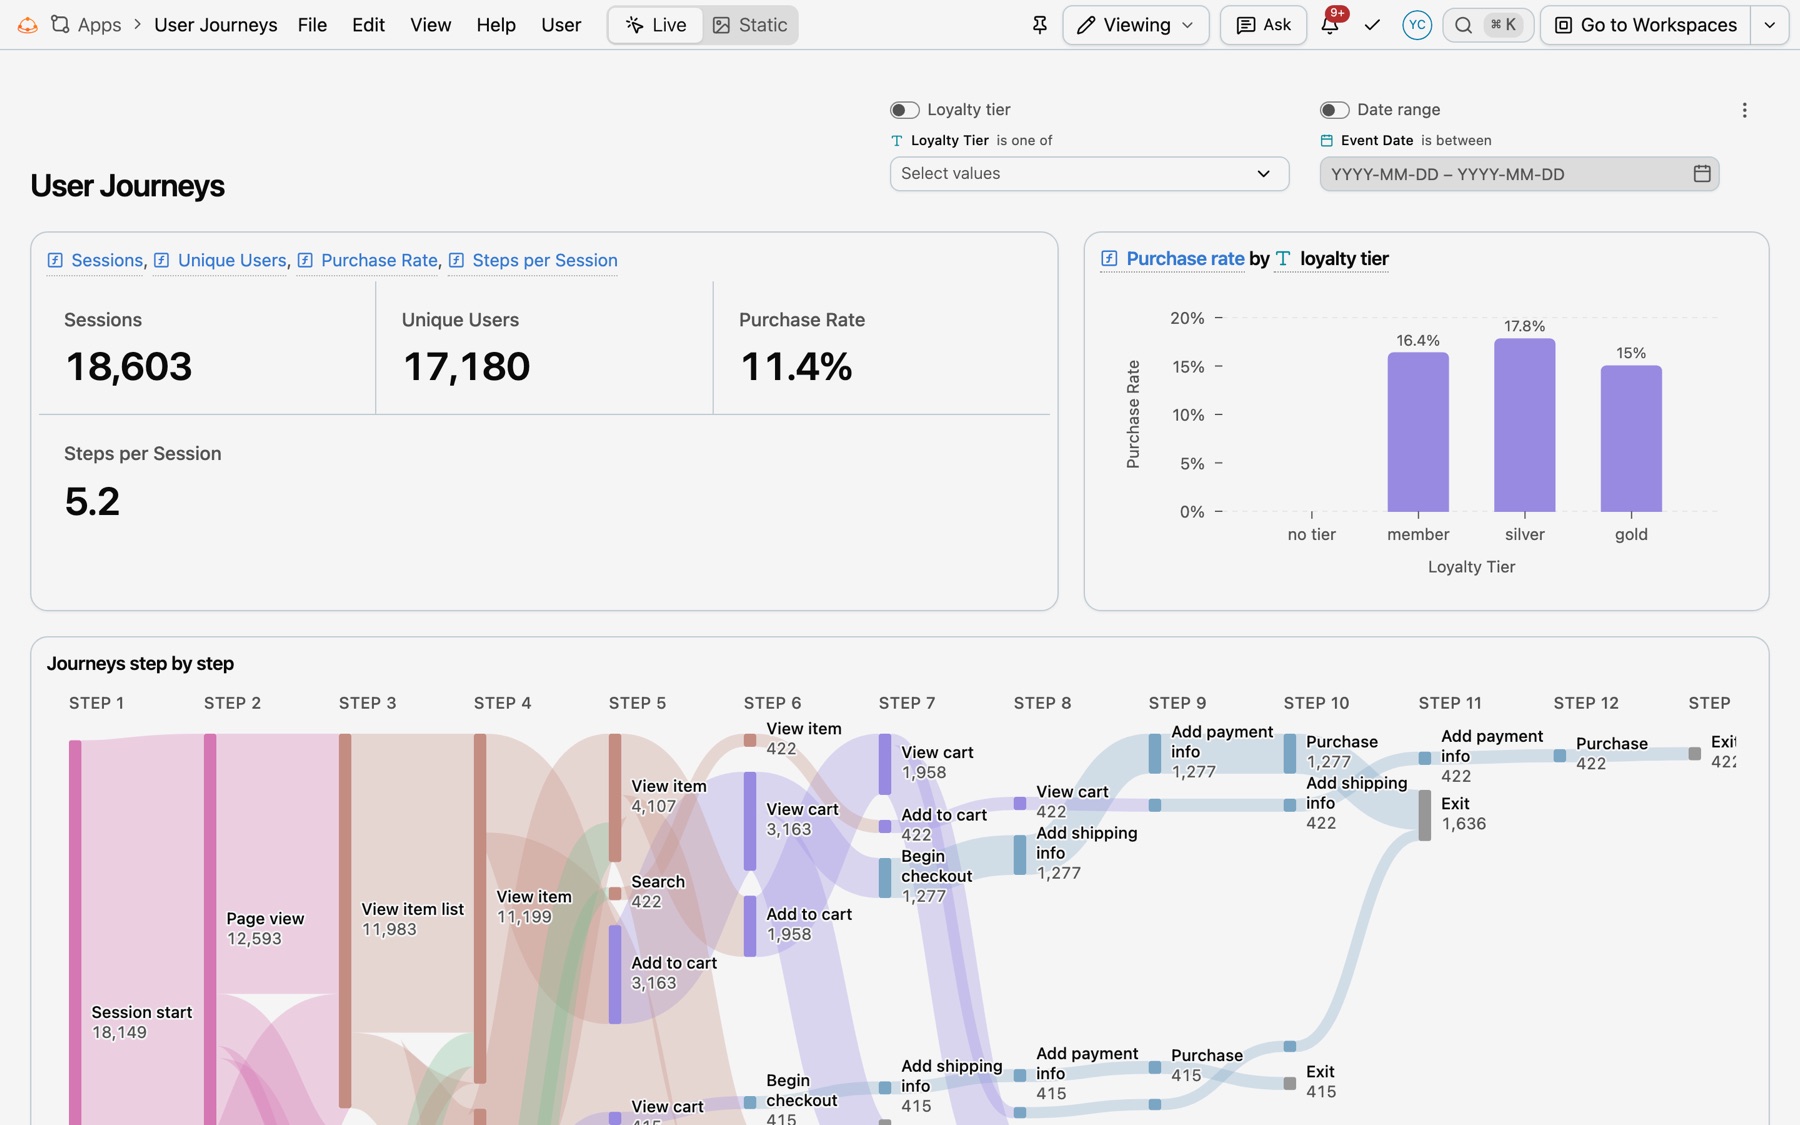
Filters for loyalty tier and date, the KPI row, purchase rate by tier, and the step-by-step flow.
Rebuild prompt
Prompt
Build a User Journeys app from our GA4 events showing how shoppers move through a session from start to purchase or exit. Put loyalty-tier and date-range filters in the header and a KPI row with journey sessions, users, purchase rate and steps per session, next to a bar of purchase rate by loyalty tier. Below that: a step-by-step Sankey coloured by stage (Entry, Browse, Store, Cart, Checkout, Post-purchase, Exit) with completion rate on hover; a second Sankey of every move between events with users and average seconds to the next event; and a table of the most common complete session paths with sessions, completion rate and step count.
Variations to try
- “Add a device filter and compare mobile with desktop.”
- “Show where gold-tier shoppers leave checkout compared with members.”