App
Printable report
Lifecycle
Leadership
Retention Scorecard
The monthly retention scorecard a lifecycle marketer sends leadership, as a printable report.
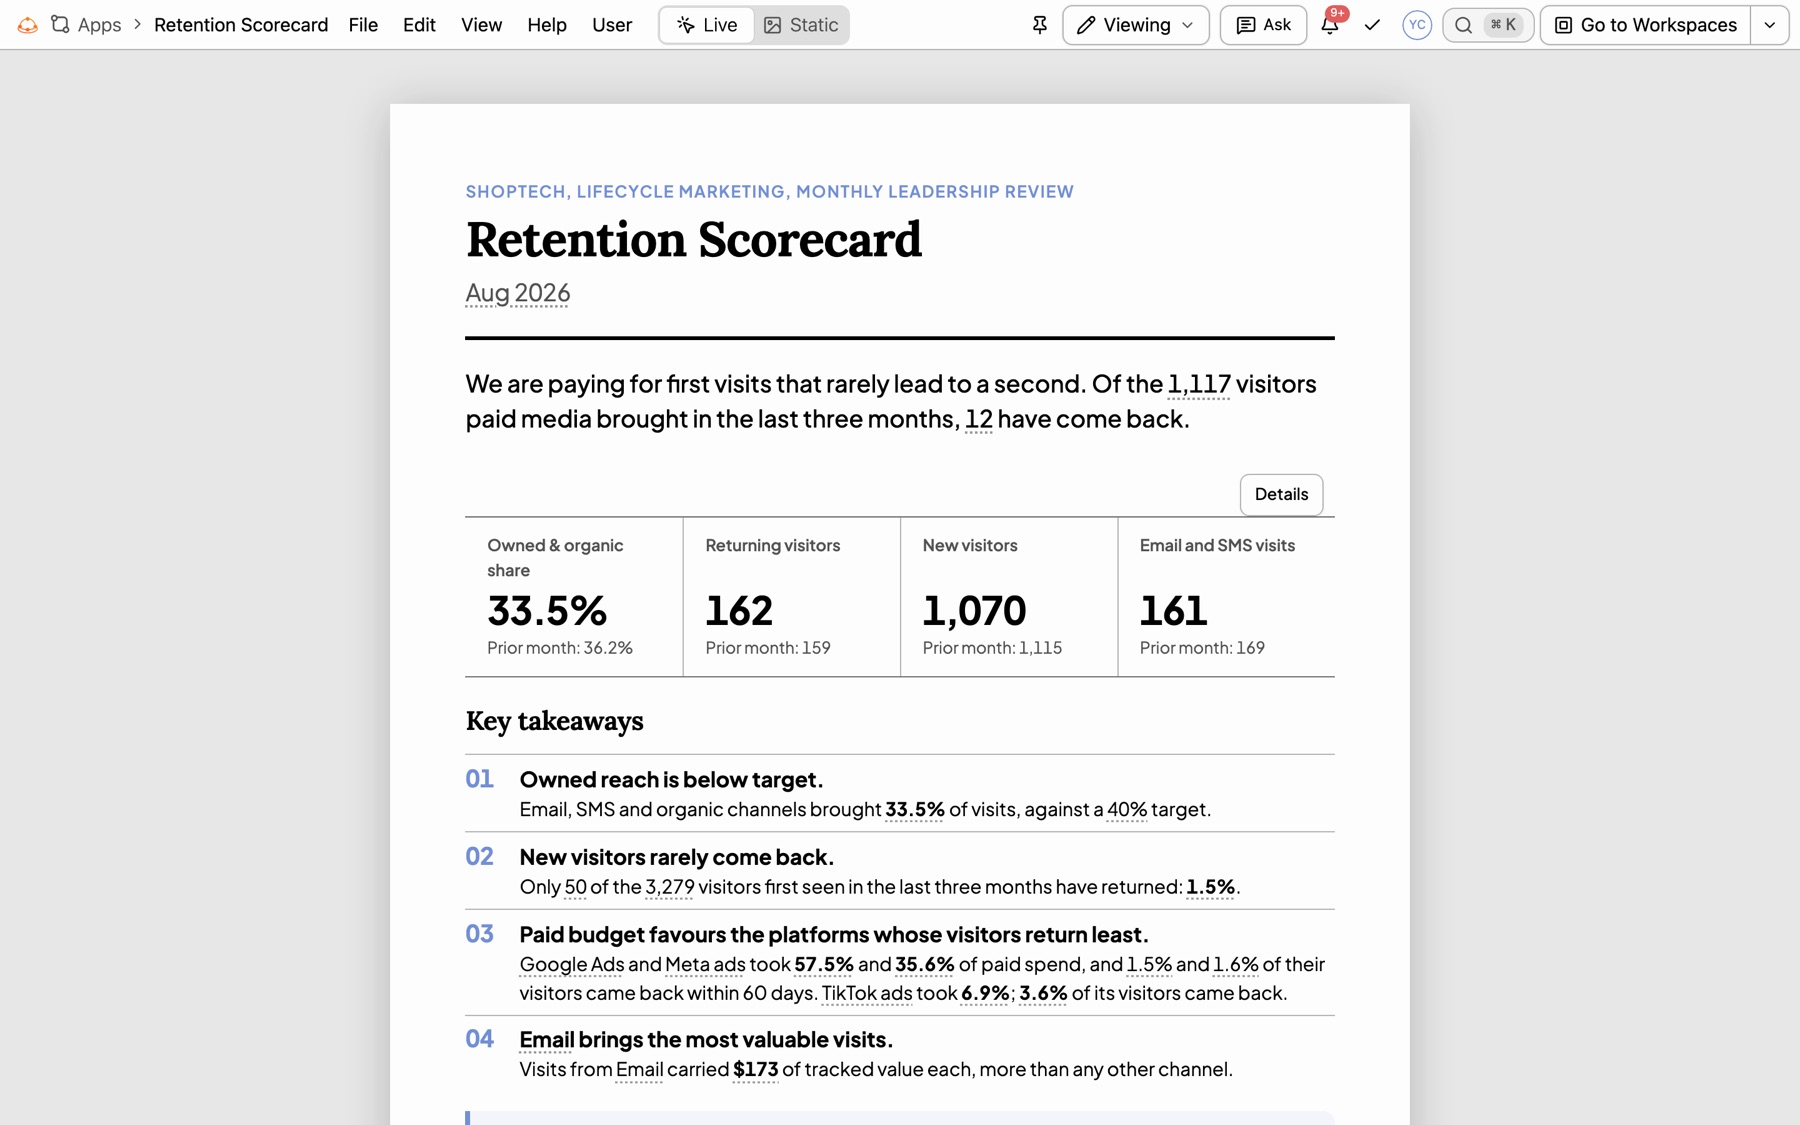
Page one: the bottom line, four headline figures against the month before, and key takeaways.
Rebuild prompt
Prompt
Build a printable monthly Retention Scorecard for leadership from GA4 sessions and ad spend, always for the latest complete month in the data. Page one: a one-line bottom line on how many visitors paid media brought in the last three months and how many came back; four headline figures against the month before (owned and organic share of visits, returning visitors, new visitors, email and SMS sessions); four numbered takeaways and three recommendations. Then owned reach (owned and organic share month by month against a 40% target, and sessions, returning visitors and tracked value per visit by channel); retention (60-day return rate by first-touch source as a horizontal bar, and a monthly cohort grid); paid media (each platform’s share of spend beside its 60-day return rate, the last three months of email and SMS campaigns, and next month’s win-back audience). End with an appendix of sources.
What is in it
- A summary page: a bottom-line sentence, The month in four figures, numbered takeaways and recommendations.
- Owned reach: a composed chart of share against target, and a table of what each channel brought.
- Retention: a horizontal bar by first touch and a cohort grid of return rates.
- Paid media: spend share beside return rate, lifecycle email and SMS campaigns, a win-back audience callout and a sign-off block.
- A last sheet with the sources list, written by
<kater-appendix>, that says where every figure came from.
Variations to try
- Change the target: “Set the owned and organic target to 35% and say how far off we are.”
- Add a page: “Add a page on email performance by campaign, with open-to-visit rate.”
- Make it quarterly: “Run this for the latest complete quarter instead of the month.”
Assumptions to adjust
- A visitor “came back” when they have a second session within 60 days of their first.
- Owned and organic means email, SMS, organic search and organic social.
- Revenue is each platform’s own attributed value; it is not deduplicated across platforms.