App
Interactive page
Paid media
Paid media performance
A small starter app on a shared workspace: monthly spend by platform and an ad groups table.
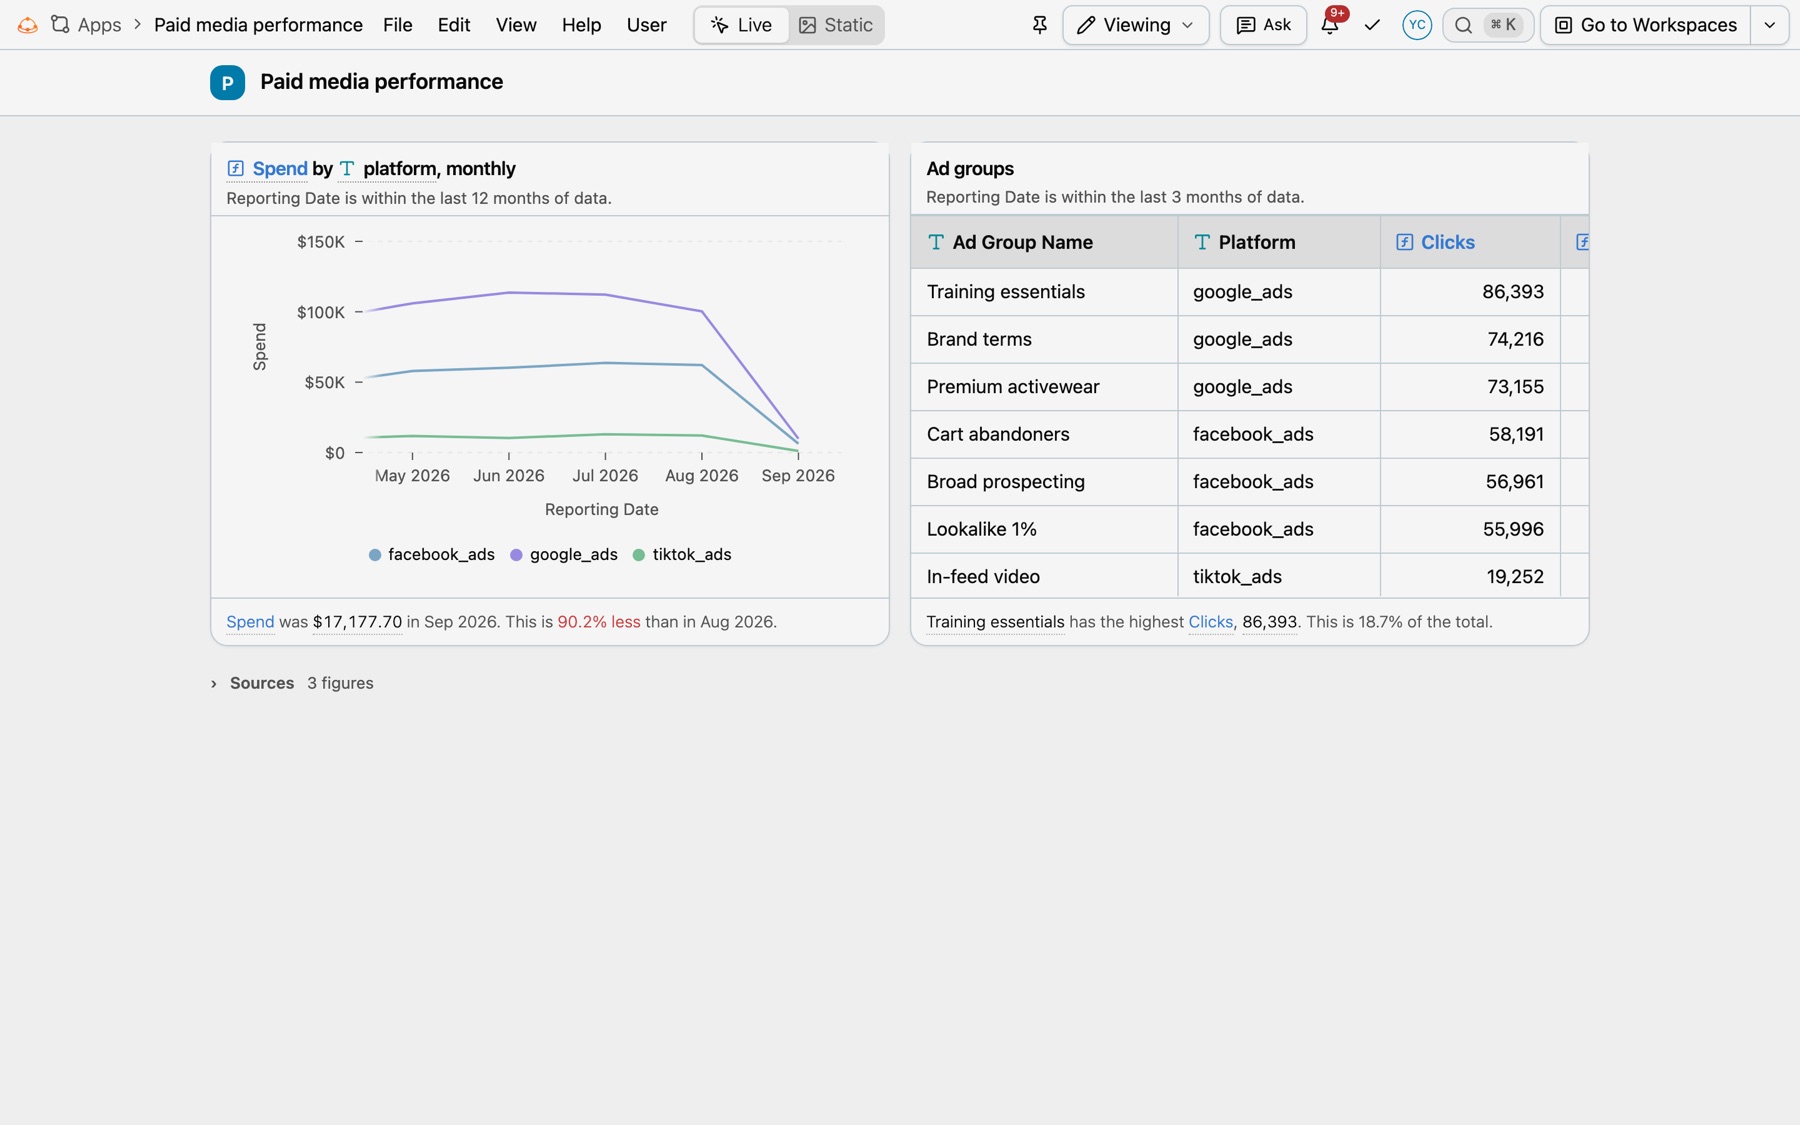
Spend by platform by month, and ad groups with clicks and conversions.
Rebuild prompt
Prompt
Create a Paid media performance app on the Ad Reporting workspace: a monthly line chart of spend by platform (Google Ads, Meta, TikTok) for the last 12 complete months, next to a table of ad groups with platform, clicks and conversions for the last three months.
Then refine it
- “The September point on this chart is a partial month. End the trend at the last complete month.”
- “Add a KPI row with spend, conversions and cost per conversion for last month.”