
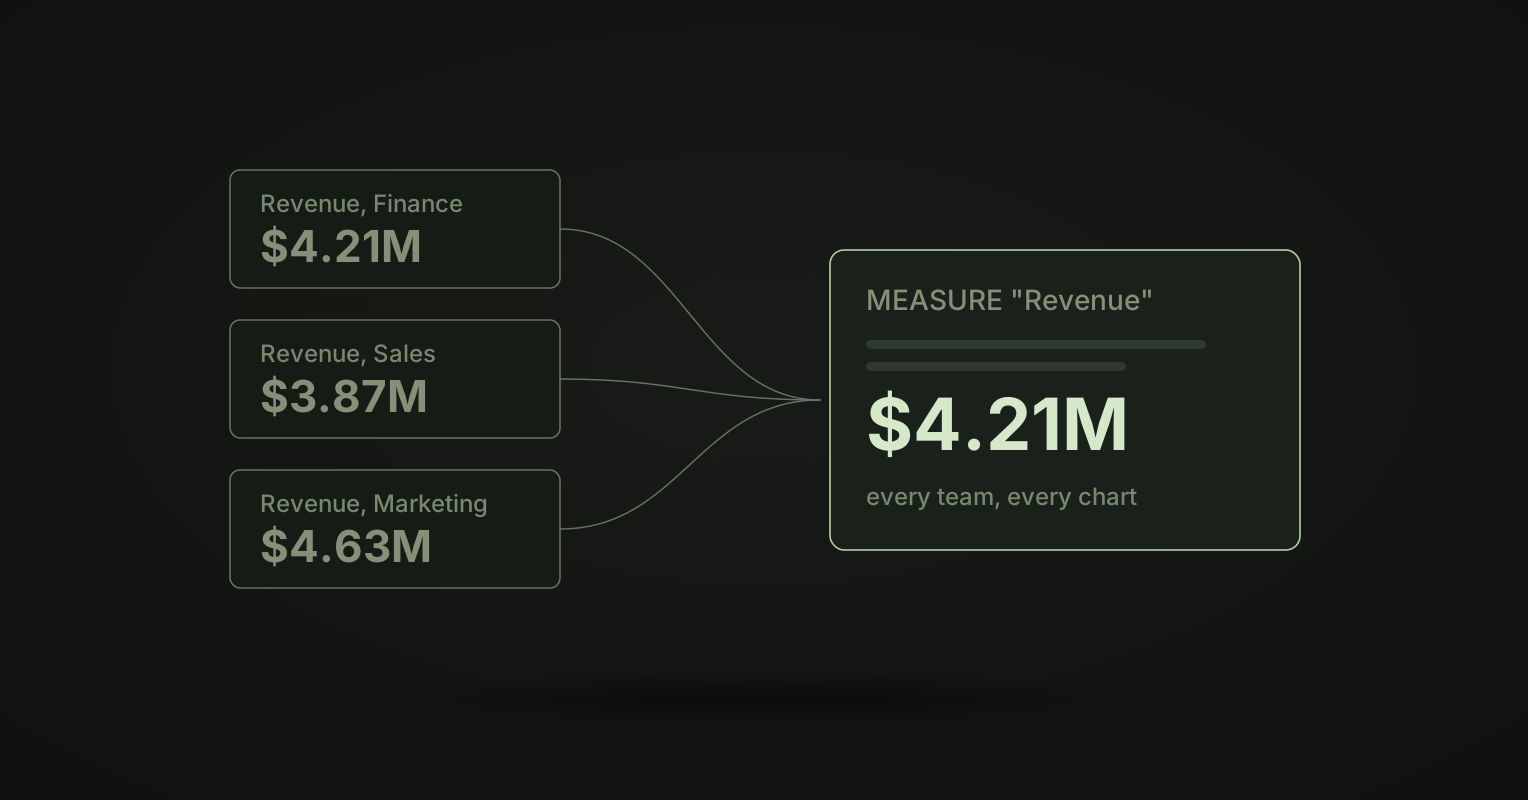
The weekly meeting starts. Finance shows revenue for last month. Sales shows a different number for the same month. Marketing has a third. The next twenty minutes go to finding out why, and nobody talks about what to do.
This is one of the most common complaints about BI. A typical pattern: one team counts revenue by invoice date, another by order date, a third by the date the cash arrived. Leadership gets three answers to one question. Ably’s product operations team put it plainly: “you’d open two dashboards that should agree, find they didn’t, and have no way of knowing which one to believe.”
The cost is not just the twenty minutes. When numbers disagree, people stop trusting all of them. They go back to their own spreadsheet, and now there are four numbers.
Where conflicting numbers come from
No one sets out to make two revenue numbers. It happens one reasonable step at a time.
- Every dashboard writes its own formula. In most BI tools, a calculated field lives inside one dashboard or one workbook. The next person who needs revenue writes it again.
- Small choices add up. Order date or invoice date. With refunds or without. Gross or net of discounts. Which currency. Each choice is fine. Two different choices give two different numbers.
- Nothing shows the copies. A formula inside a dashboard is hard to find from outside it. Nobody can search every dashboard for “revenue” and see the five versions.
- AI makes it faster. A chat tool that writes its own SQL makes a new formula for every question. Ably found that the faster people got answers, the faster inconsistencies turned into confident wrong decisions.
The fix: one definition, read everywhere
The answer is a semantic layer: a place where each metric is defined once, and every chart reads that definition instead of writing its own.
In Kater, a measure is declared once
Kater’s semantic layer is Kater SQL, which is your warehouse’s own SQL plus a few additions. Revenue is declared once, in a shared model:
-- @description Order amount before discounts.MEASURE('sum__amount', KATER__SUM(orders.amount), NOT_ADDITIVE_ACROSS(currency)) AS "Revenue",Every query that reads it evaluates it again at that query’s own grouping and filters. So revenue by region, by month and by product all use the same formula. The definition can also carry rules, such as NOT_ADDITIVE_ACROSS(currency): revenue in different currencies must never be added together.
A query in a workspace reuses the measure by name. It never says how revenue is calculated, so it cannot calculate it differently. If the shared definition changes, every query, chart, dashboard and app that reads it changes with it.
Promotions find the copies you already have
Most teams do not start clean. They already have the same metric written in many places. Promotions find them.
Kater groups fields by a fingerprint of their formula, so roas and week_roas match even with different names. No language model is involved in finding repeats. For each group, Kater drafts the change that moves the field into one shared definition. It runs the draft on your warehouse twice and labels it Results match, Results differ or Not verified. An admin selects Apply or Dismiss.
Tests stop a number from moving by surprise
A definition can change for good reasons. It should not change by accident. With model tests, you pin known answers for a model. A change that moves one of those numbers fails the test, so you know before anyone reads the new figure.
Verified marks say which number to use
A field is verified only when a shared model defines it, and the verified mark shows beside it. A number computed in one workspace has no mark until a promotion moves it into a shared model. The data team can also add a curated tag to the models, queries and workspaces it recommends. Neither changes permissions.
What the meeting looks like after
Finance, Sales and Marketing open their own dashboards. The revenue number is the same in all three, because all three read one measure. If someone wants revenue by invoice date for a reason, that is a second measure with its own name and description, not a hidden variant of the first.
The meeting talks about why revenue moved, not which revenue is right.
Frequently asked questions
Why do two dashboards show different numbers for the same metric?
Usually because each dashboard calculates the metric itself. One counts revenue by order date, another by invoice date, and a third leaves out refunds. Each formula is reasonable on its own, but nothing makes them agree.
How does Kater keep one definition for a metric?
In Kater, a measure is declared once in a shared model in Kater SQL. Every query that reads it evaluates it again at its own grouping and filters. If the definition changes, every query, chart, dashboard and app that reads it changes with it.
What if the same metric is already defined in many places?
Kater Promotions find fields that several queries define again, by a fingerprint of their formula. Kater drafts the change that moves them into one shared definition, runs it on your warehouse to check that every number stays the same, and an admin applies it.
Can a definition change move numbers by surprise?
You can pin known answers for a model with tests. A change that moves one of those numbers fails the test, so you find out before anyone reads the new figure.
Want to see one definition behind every chart, on your own data? Book a demo.